Introduction
If technical analysis has a "Holy Grail," it must be: trends, support, and resistance. These three concepts run through the entire technical analysis system. Regardless of which tools or indicators you use, they all ultimately come down to these three. Master them, and you master the market's pulse.
Definition and Importance of Trends
What is a Trend?
Simplest Definition:
- Uptrend: Price continuously creates higher highs and higher lows
- Downtrend: Price continuously creates lower highs and lower lows
- Sideways: Price oscillates back and forth within a range
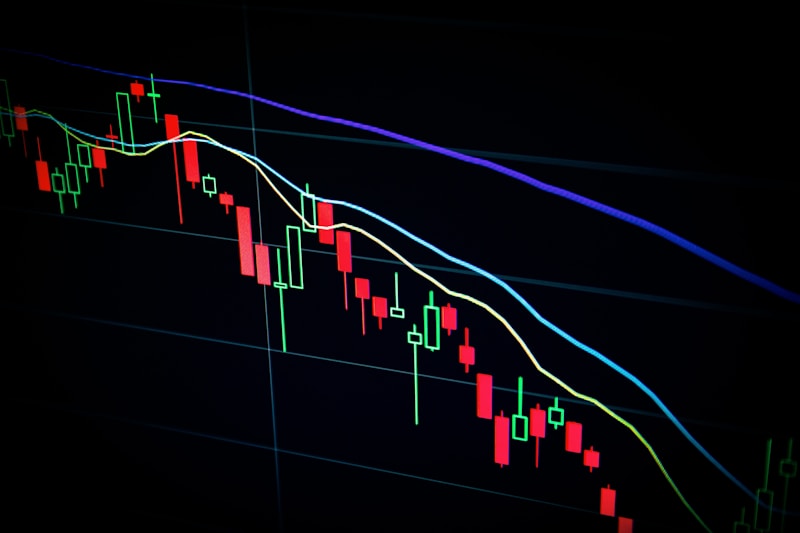
Visual Understanding
Uptrend:
     High3
    /
   High2
  /
 High1
       Low3
      /
     Low2
    /
   Low1
Characteristics: Higher highs + Higher lows
Downtrend:
   High1
    \
     High2
      \
       High3
 Low1
  \
   Low2
    \
     Low3
Characteristics: Lower highs + Lower lows
Why Are Trends So Important?

Core Principle:
"The Trend is Your Friend"
Reasons:
- Trend Trading Has Higher Win Rate
- Trading with the trend means standing with the market majority
- Counter-trend trading is like rowing upstream—hard and dangerous
- Trends Have Persistence
- Newton's First Law: Objects maintain their state of motion unless changed by external force
- Market trends are the same—once formed, they tend to continue
- Profit Maximization
- The middle of a trend is the most profitable part
- Catching the trend = catching the fattest profits
The Nature of Support and Resistance
What is Support?
Definition:
Support is a price level where, after price declines, buying power strengthens, preventing further decline.
Vivid Metaphor:
- Support is like the floor—price "bounces" when it hits
- Buy orders emerge here, supporting the price
Why Does Support Exist?
- Psychological Price Levels
- Round numbers (like $60,000, $50,000)
- Investors instinctively want to "buy low"
- Previous Important Points
- Previous lows
- Previous highs (become support after breaking down)
- Technical Factors
- Moving averages
- Trendlines
- Fibonacci retracement levels
What is Resistance?
Definition:
Resistance is a price level where, after price rises, selling power strengthens, preventing further rise.
Vivid Metaphor:
- Resistance is like the ceiling—price gets "pushed back down" when it hits
- Sell orders emerge here, suppressing the price
Why Does Resistance Exist?
- Previously Trapped Longs
- Investors who bought at highs want to break even
- They sell when price returns to their cost basis
- Profit Taking
- Previous buyers want to take profits at resistance
- Collective selling creates pressure
- Psychological Price Levels
- Round numbers (like $70,000, $100,000)
- Historical highs
Role Reversal Between Support and Resistance
Key Concept:
Support and resistance undergo "Role Reversal"

Scenario 1: Support Breaks → Becomes Resistance
Price Movement:
$65,000 ←─── Was support before
      │
      ↓ Broke down
      │
   $63,000 (Current price)
      ↑
      │ Meets resistance when bouncing
      │
   $65,000 ←─── Now becomes resistance!
Reason:
- Those who bought at $65,000 are now trapped
- When price rebounds to $65,000, they want to sell to break even
- Forms selling pressure = becomes resistance
Scenario 2: Resistance Breaks → Becomes Support
Price Movement:
$70,000 ←─── Was resistance before
      ↑
      │ Broke out
      │
   $72,000 (Current price)
      │
      ↓ Gets support when retesting
      │
   $70,000 ←─── Now becomes support!
Reason:
- After breaking $70,000, bulls gain confidence
- When pulling back to $70,000, new buy orders emerge
- Previous shorts also admit defeat and buy here
- Forms buying = becomes support
How to Identify Key Support and Resistance
Method 1: Historical Highs and Lows
Most Direct and Effective Method
Search Steps:
- Open daily chart (or your main trading timeframe)
- Find recent important highs and lows
- Mark these price levels
- Observe reactions when price approaches
Examples:
- Bitcoin 2021 high $69,000 → Long-term resistance
- Bitcoin 2022 low $15,500 → Long-term support
Method 2: Round Numbers
Manifestation of Human Psychology
Common Round Numbers:
- $10,000, $20,000, $30,000...
- $15,000, $25,000, $35,000...
- $50,000, $60,000, $70,000...
Why Effective?
- Investors like to place orders at round numbers
- News media loves reporting round number breakouts
- Collective psychology forms actual support/resistance
Method 3: Previous Consolidation Zones

Logic:
- Price consolidates in a range for extended period → Large volume of trading occurs
- That range has many "cost holders"
- When price returns, it will meet support or resistance
Identification Method:
- See where on the candlestick chart price consolidated longest
- Confirm with Volume
- That area is important support/resistance zone
Method 4: Moving Averages
Dynamic Support and Resistance
Commonly Used MAs:
- MA20 (20-day): Short-term support/resistance
- MA50 (50-day): Medium-term support/resistance
- MA200 (200-day): Long-term support/resistance
Usage:
- In uptrends, MAs act as support
- In downtrends, MAs act as resistance
- Price breaking above/below MA = Trend may change
Method 5: Trendlines
Connect Highs or Lows
Uptrend Line (Support):
- Connect two or more lows
- Extends to upper right
- Price gets support when pulling back to it
Downtrend Line (Resistance):
- Connect two or more highs
- Extends to lower right
- Price meets resistance when bouncing to it
Judging Strength of Support and Resistance
Characteristics of Strong Support/Resistance
1. Number of Tests
More tests = More important
Example:
$60,000 tested 3 times without breaking
→ This is strong support!
→ More reliable on the 4th test
2. Time Span
Longer existence = More important
Example:
$50,000 acted as support multiple times over past year
→ This is a very critical psychological level
3. Volume
Accompanied by high volume = More important
Example:
Price oscillates around $65,000 with huge volume
→ Shows many "cost holders" here
→ Must be important support/resistance in future
4. Price Reaction Magnitude
Larger bounce/drop = More important
Example:
Price drops to $55,000 then quickly rebounds 10%
→ Shows $55,000 is strong support
Real Case Analysis
Case 1: Bitcoin's Support Turning to Resistance
Background (2021-2022):
- $60,000 initially was resistance (March 2021)
- Failed to break multiple times
- Finally broke through in April
- After breakout, $60,000 became support (April-Oct 2021)
- Price tested $60,000 support multiple times
- Role reversal successful ✓
- Early 2022 broke below $60,000
- Support was broken
- Became resistance again ↔️
- During 2022 bounce, $60,000 acted as strong resistance
- Prevented price from bouncing
- Role reversal verified again ✓
Lessons:
- Breakouts/breakdowns of key levels are very important
- Role reversals happen repeatedly
- Dynamically adjust your support/resistance assessment
Case 2: Ethereum's Round Number
$3,000 Level Analysis:
Stage 1: First Breakout (April 2021)
- $3,000 was resistance before
- After breaking, quickly rose to $4,000
- Psychological effect of round number clear
Stage 2: Retest Confirmation (July 2021)
- Price pulled back to $3,000
- Got support here and bounced
- Confirmed role reversal ✓
Stage 3: Resistance After Breaking Down (May 2022)
- Price broke below $3,000
- Met resistance at $3,000 when bouncing
- Confirmed role reversal again ✓
Combining Trends with Support and Resistance
Support in Uptrends

Strategy:
- Confirm uptrend (higher highs and lows)
- Wait for price pullback to support
- Trendline
- Previous high (now converted to support)
- Key MAs (MA50, MA200)
- Buy near support level
- Set stop-loss below support
- Set target at previous high or next resistance
Core Logic:
- Follow major trend (upward)
- Buy the dip (buy at support)
- Risk controlled (stop below support)
- Good risk-reward (target at resistance)
Resistance in Downtrends
Strategy:
- Confirm downtrend (lower highs and lows)
- Wait for price bounce to resistance
- Downtrend line
- Previous low (now converted to resistance)
- Key MAs (MA50, MA200)
- Sell short (or sell) near resistance
- Set stop-loss above resistance
- Set target at previous low or next support
Core Logic:
- Follow major trend (downward)
- Sell the rally (sell at resistance)
- Risk controlled (stop above resistance)
- Good risk-reward (target at support)
Common Mistakes and Solutions
Mistake 1: Support/Resistance is an Exact Point
Wrong Concept:
❌ "Support is $60,000, must wait for exactly $60,000 to buy"
Correct Understanding:
✅ Support/resistance is a "zone" not a "point"
Example:
- Support zone: $59,800 - $60,200
- Can consider action when price enters this zone
- Don't wait for precision to the decimal
Practical Advice:
- Use "zone thinking" instead of "point thinking"
- Can enter in stages (like $60,200, $60,000, $59,800)
- Key is "approaching" support/resistance, not "exactly hitting"
Mistake 2: Support/Resistance Won't Be Broken
Wrong Concept:
❌ "This support is so strong, it absolutely won't break"
Reality:
✅ All support/resistance can be broken
Reasons:
- Market sentiment changes
- Breaking news events
- Large capital flows
- Technical breakdown
Response:
- Always set stop-loss
- Exit immediately if support breaks
- Don't fantasize "it will come back"
Mistake 3: Ignoring Larger Timeframe Support/Resistance
Wrong Concept:
❌ Only looking at 1-hour chart support/resistance
Problem:
- Small timeframe support/resistance is weaker
- May be suppressed by larger timeframe forces
Correct Approach:
✅ Look at multiple timeframes simultaneously
Example:
- H1 (1-hour) shows support at $61,000
- D1 (Daily) shows resistance at $61,500
→ Even if H1 support holds, hard to break D1 resistance
→ Limited upside, poor risk-reward
→ Should skip this trade
Checklist
Before each trade, confirm the following:
Trend Assessment
- [ ] What is the current trend? (Up/Down/Sideways)
- [ ] In which timeframe? (Daily/4-hour/1-hour)
- [ ] Is the trend intact? (Clear highs and lows)
Support/Resistance Identification
- [ ] Where is nearest support? (Mark on chart)
- [ ] Where is nearest resistance? (Mark on chart)
- [ ] Near key support/resistance?
Strength Assessment
- [ ] How many times tested?
- [ ] How long has it existed?
- [ ] High volume associated?
- [ ] Strong price reaction?
Multi-Timeframe Confirmation
- [ ] Where is larger timeframe (D1) support/resistance?
- [ ] Where is medium timeframe (H4) support/resistance?
- [ ] Where is smaller timeframe (H1) support/resistance?
- [ ] Are different timeframes consistent?
Role Reversal
- [ ] Was this support previously resistance? (or vice versa)
- [ ] Has breakout/breakdown been confirmed?
- [ ] Has role reversal succeeded?
Conclusion
Trends, support, and resistance are the foundation of technical analysis. Remember:
Core Principles:
- The Trend is Your Friend
- Trade with the trend for higher win rate
- Counter-trend trading has extreme risk
- Support/Resistance Role Reversal
- Resistance becomes support after breakout
- Support becomes resistance after breakdown
- Dynamically adjust your assessment
- Zone Thinking
- Support/resistance is a zone, not an exact point
- Allow for some price fluctuation range
- Multi-Timeframe Analysis
- Larger timeframe support/resistance more important
- Smaller timeframe for precise entry
- Best results combining both
- Always Set Stop-Loss
- Any support/resistance can be broken
- Capital protection is priority #1
Master these core concepts, and you can read the market's language!
Further Reading
- Support and Resistance (Technical Analysis)
- Trendlines and Channels (Technical Analysis)
- Dow Theory and Trends (Technical Analysis)
- Risk Control Core Principles (Risk Management)
FAQ
Q: Is support/resistance an exact price or a zone?
A: Support and resistance should be treated as "zones" rather than exact prices. For example, support at $60,000 might actually be a $59,800-$60,200 zone. This is because different traders set orders at slightly different prices. In practice, use "zone thinking" and enter in stages within the support/resistance area rather than waiting for one exact price.
Q: How can I tell if a support level will hold or break?
A: No method can predict with 100% certainty whether support will hold. However, you can watch for clues: is the bounce strength weakening each time price approaches support? Is volume declining? Does the larger timeframe trend support the level? If price tests the same support multiple times with increasingly weak bounces, the probability of a breakdown increases. This is why you always need a stop-loss.
Q: Does the role reversal between support and resistance always happen?
A: Not always, but it is a high-probability event. The success rate depends on the strength of the breakout. A strong breakout accompanied by heavy volume has a higher chance of successful role reversal. A weak breakout (low volume, small magnitude) may be a false breakout, with price quickly returning to the original range.
Q: Why are round numbers particularly effective in crypto markets?
A: Crypto markets have a high proportion of retail traders, who tend to place buy and sell orders at round numbers. Additionally, news media frequently highlights round number milestones (like "Bitcoin breaks $100,000"), which reinforces the psychological effect. When large volumes of orders cluster near the same price level, it naturally creates effective support or resistance.
Next Article Preview: Practical Application Techniques for Trendlines
This article is for educational purposes and does not constitute investment advice. Trading involves risks; enter the market with caution.