Introduction
This chapter selects key content from "Japanese Candlestick Charting Techniques" to help you quickly master the essential candlestick patterns needed for chart trading. If time permits, reading the full book is highly recommended.
Candlestick vs Line Charts
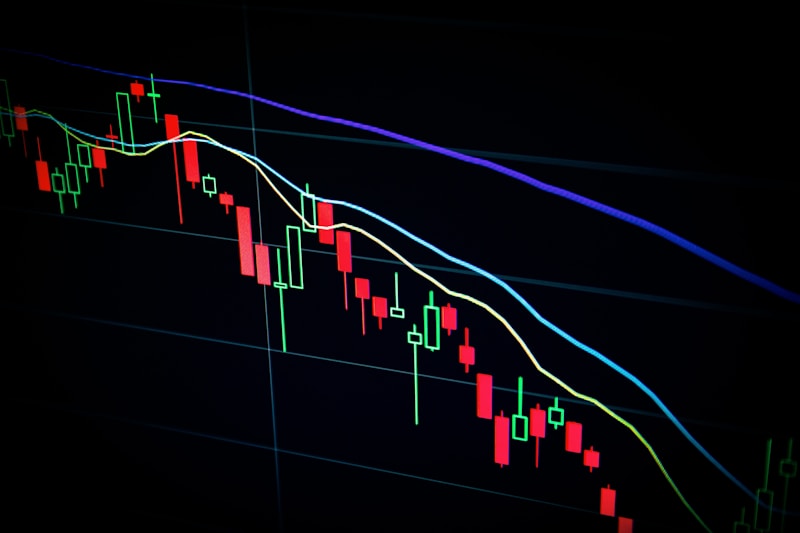
When comparing line charts with candlestick charts side by side, the difference is immediately apparent. On candlestick charts, price fluctuations leap off the page, creating a three-dimensional market visualization. Candlestick charts elevate flat two-dimensional line charts into three-dimensional images, making them more visually exciting.
Basic Structure of Candlesticks
Four Key Prices
When drawing candlestick charts, each line requires four prices:
- Open Price
- High Price
- Low Price
- Close Price
The Body
Inside the candlestick line, there's a thick section called the body. It represents the price range between the open and close prices for the trading session.
Black/Red Body:
- Close < Open
- Indicates decline for the day
- Bears are stronger
White/Green Body:
- Close > Open
- Indicates rise for the day
- Bulls are stronger
Shadows (Wicks)
Above and below the body are thin vertical lines called shadows.
Upper Shadow:
- Line above the body
- Top = Day's high price
- Shows extreme upward price movement
Lower Shadow:
- Line below the body
- Bottom = Day's low price
- Shows extreme downward price movement
Basic Candlestick Patterns
1. Long Black Body
Characteristics:
- Open near the high
- Close near the low
- Large price range
Meaning:
- Weak market sentiment
- Strong bearish force
- High probability of continued decline
2. Long White Body
Characteristics:
- Open near the low
- Close near the high
- Large price range
Meaning:
- Strong market sentiment
- Strong bullish force
- High probability of continued rise
3. Spinning Top
Characteristics:
- Small body
- Can be black or white
- Shadow length doesn't matter
Meaning:
- Bulls and bears are in equilibrium
- Difficult to determine direction
- Neutral in sideways trading ranges
Key Point:
The spinning top is called so precisely because its body is very small.
4. Doji
Characteristics:
- No body or extremely small body
- Body essentially becomes a horizontal line
- Open and close at same level or very close
Meaning:
- Carries reversal signal implications
- Market indecision
- Trend may change
Importance:
Doji are very important reversal signals, especially when appearing at trend extremes.
Practical Application Tips
Tip 1: Observe Body Size
Larger body → Stronger force
Smaller body → Weaker force
Large Bodies:
- Indicate strong trends
- Can trade with the trend
Small Bodies:
- Indicate market hesitation
- May signal trend reversal
Tip 2: Notice Shadow Length
Long Upper Shadow:
- Market attempted to rally
- But was pushed back by selling pressure
- May be a top signal
Long Lower Shadow:
- Market dropped significantly
- But was pulled back by buying
- May be a bottom signal
Tip 3: Combine with Position
The same candlestick has completely different meanings in different positions:
Top of Uptrend:
- Doji, Spinning Top → Warning signals
- Long upper shadow → Sell signal
Bottom of Downtrend:
- Doji, Spinning Top → Possible reversal
- Long lower shadow → Buy signal
The Power of Candlestick Combinations
Single candlesticks have limited meaning, but combined with preceding and following candles, they provide much more information:
Consecutive Black Candles
- Continued decline
- Bears dominate
- Wait for reversal signals
Consecutive White Candles
- Continued rise
- Bulls dominate
- Watch for overheating signals
Alternating Black and White
- Choppy market
- Bulls and bears in equilibrium
- Wait for breakout direction
Common Mistakes
❌ Mistake 1: Deciding on a Single Candlestick
Single candlesticks only provide reference. Must combine with:
- Trend direction
- Support/resistance levels
- Volume
- Surrounding candlesticks
❌ Mistake 2: Ignoring Timeframes
Candlesticks on different timeframes have different significance:
- Daily doji more important than 1-hour doji
- Need multi-timeframe analysis
❌ Mistake 3: Mechanically Applying Patterns
Markets are dynamic, must be flexible:
- Patterns are reference, not absolute
- Must consider market context
- Don't be rigid
Candlestick Analysis Checklist
When analyzing candlesticks, ask yourself:
- [ ] Is the body large or small?
- [ ] Is it black or white?
- [ ] Are there prominent shadows?
- [ ] Where does it appear? (Top/Bottom/Middle)
- [ ] What's the current trend?
- [ ] What are the surrounding candlesticks?
- [ ] How does volume confirm?
Practice Recommendations

1. Daily Observation
- Record 10 key candlesticks daily
- Analyze their patterns and meanings
- Predict next day's movement
- Verify predictions
2. Historical Review
- Find important turning points in history
- Analyze candlestick patterns at those times
- Summarize patterns
3. Real-time Practice
- Observe real-time candlestick formation
- Understand price movement logic
- Develop market feel
Advanced Learning Directions
After mastering basic candlesticks, you can learn:
- Complex Patterns
- Hammer, Hanging Man
- Engulfing patterns
- Morning Star, Evening Star
- Candlestick Combinations
- Two-candle combinations
- Three-candle combinations
- Multi-candle patterns
- Combining with Other Tools
- Candlesticks + Support/Resistance
- Candlesticks + Trendlines
- Candlesticks + Volume
Conclusion
Candlestick charts are the foundation of technical analysis, but not everything. Remember:
- Candlesticks are just tools: Don't over-rely
- Combine with other factors: Trend, support/resistance, volume
- Continuous practice: Practice makes perfect
- Stay objective: Don't speculate subjectively
Master candlestick basics, and you've taken the first step in technical analysis!
Further Reading
- Hammer and Hanging Man Patterns (Technical Analysis)
- Support and Resistance (Technical Analysis)
- Dow Theory and Trends (Technical Analysis)
- How to Buy Bitcoin for the First Time (Exchange Guide)
FAQ
Q: What are the four key prices in a candlestick?
A: Each candlestick consists of four prices: Open, High, Low, and Close (OHLC). The body represents the range between open and close prices, while the shadows (wicks) show the extreme high and low prices reached during that period.
Q: What does a Doji candlestick mean?
A: A Doji indicates that the open and close prices are nearly identical, representing market indecision. When a Doji appears at the end of a clear trend, it may signal a reversal. However, never make trading decisions based on a single candlestick — always combine with trend direction, support/resistance levels, and volume.
Q: Where should beginners start learning candlestick charts?
A: Start by understanding the basic structure (meaning of bodies and shadows), then learn to identify the four fundamental patterns: long black body, long white body, spinning top, and Doji. Practice by observing and recording 10 candlesticks daily on exchange charts. You can practice on charting tools at Binance or OKX.
Q: What is the difference between candlesticks on different timeframes?
A: Longer timeframe candlesticks carry more significance. A Doji on a daily chart is more meaningful than one on a 1-hour chart. We recommend multi-timeframe analysis: use daily or 4-hour charts to identify the overall trend, then use 1-hour or 15-minute charts to find specific entry and exit points.
Q: Can I trade successfully using only candlestick analysis?
A: Candlesticks are a foundational technical analysis tool, but should not be relied upon exclusively. Effective trading decisions require combining trend analysis, support/resistance levels, volume, and proper risk management. Candlesticks provide reference signals, not absolute buy/sell commands.
Next Article Preview: Key Candlestick Patterns: Hammer and Hanging Man
This article is for educational purposes and does not constitute investment advice. Trading involves risks; enter the market with caution.